Seismic anisotropy is widespread in the earth’s curst and means that seismic wave velocities vary with the propagation direction and leads to measurable differences in travletimes. This phenomenon based either on the anisotropic properties of rocks or occurs due to geological structures, such as fractures, faults and others. There are two different types of seismic anisotropy. One of them is the so called vertical transverse isotropy (VTI). The VTI is one of the most common forms of anisotropy in sedimentary formations occurs as a result of stratigraphic pressure. This kind of anisotropy results from textured minerals or sequences of horizontal thin layers. Another common type of anisotropy is the horizontal transverse isotropy (HTI) due to vertical fracturing.
In soil mechanics, the stress conditions of the subsoil are required for settlement analyses. These stresses can differ in vertical and horizontal directions depending on the soil load and previous geological history. Differences between SH- and SV-wave velocities show that the underground is often not isotropic but referred to S-wave anisotropy. The differences in velocity distribution are mostly geologically induced and could be, for example, due to different effective pressure, clay content or porosity. To estimate the level of S-wave anisotropy in the subsoil a jointly inversion can be applied which takes into account SV- and SH-wave velocities in conjunction with P-waves (Ketelhodt et al., 2018). The joint inversion of the dataset is recommended to reduce the multi-solutions of the inversion problem and artifacts in the S-wave tomograms. Joint P- and S-wave measurements for tomographic cross-borehole analysis offer more reliable interpretational insight concerning lithologic and geotechnical parameter variations compared to P-wave measurements on their own.
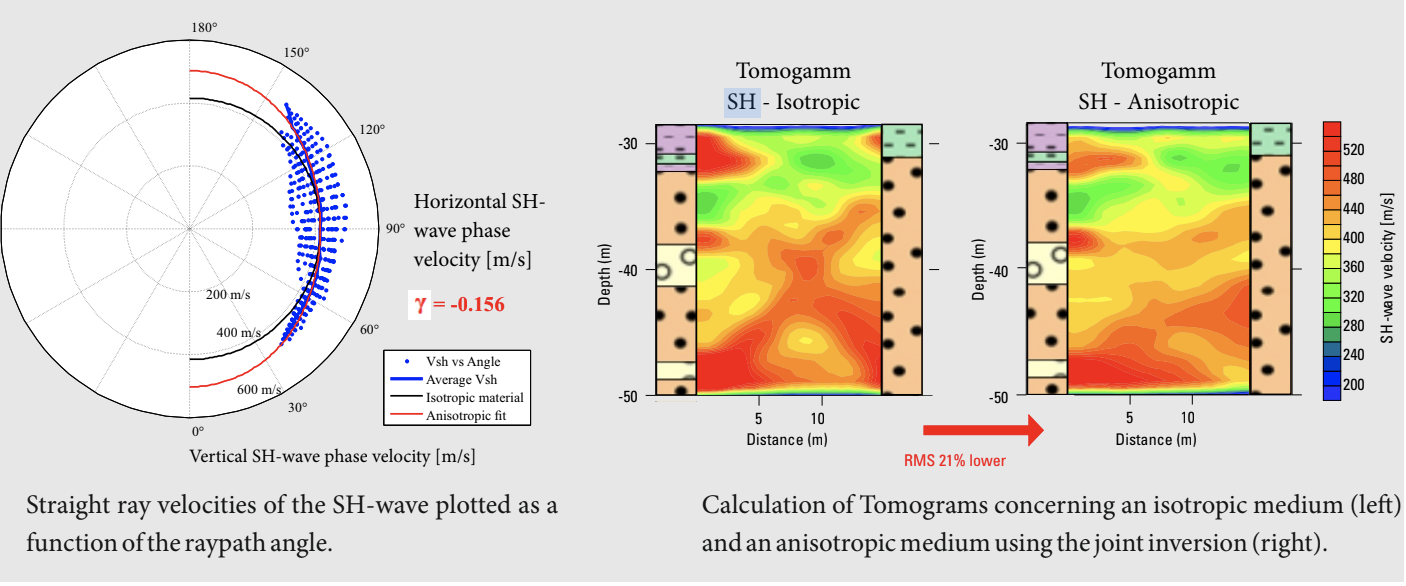
The figure on the left side shows the straight ray velocities of the SH-wave plotted as a function of the raypath angle. The mean velocities for a raypath angle are shown by the blue curve. Velocities in a homogenous isotropic medium would lie on the black curve. But it is obvious that the mean velocities and the black isotropic curve deviate for the S-wave. In this case it is of high concern to take into account the anisotropic parameters during the inversion. The calculation of the tomgram show a significant decrease of RMS (Ketelhodt et al., 2018).
References:
von Ketelhodt, J., Manzi, M., Durrheim, R. Fechner, T. (2019). Seismic VTI Parameter Inversion from P- and S-wave Cross-Borehole Measurements in an Aquifer Environment. GEOPHYSICS, 84, 1-57, 10.1190/geo2018-0335.1.
von Ketelhodt, J., Fechner, T., Manzi, M., Durrheim, R. (2018). Near Surface Geophysics, 16, 529-542.

 Enquiry:hkmarketing@epc.com.hk
  Whatsapp Enquiry: +85261990717